
1.1. Bow-Tie Diagram
1.1.1. Description and Purpose
1.1.1.1.
The bow-tie technique was first developed as a technique for developing safety cases in the Oil and Gas Industry. The principle of the technique requires the identification of hazards, circumstances (threats) and events leading to the risk realisation (usually as a fault tree), and then, a tree of consequences leading from the event to the consequences and the estimated loss (usually with an event tree).
1.1.1.2.
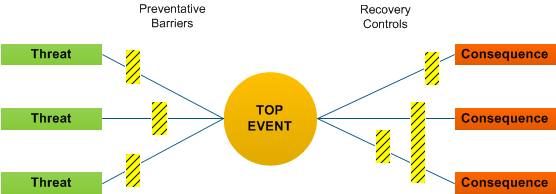
The technique combines cause and consequence analysis into one single diagram. The left hand side of the bow-tie diagram shows the casual path involving threats and preventative measures leading to the top event. The right hand side demonstrates the potential sequence of events and recovery measures following the top event.
1.1.1.3.
Preventative measures act as barriers to prevent or minimise the likelihood of events. These measures can be either technical or procedural and they can be colour coded to distinguish between the two. Recovery or mitigation measures are specified to stop propagation of events or limit the severity of the consequences.
1.1.1.4.
The bow-tie diagram derives it name by its appearance – the major incident or top event is plotted in the middle. An example is shown below.
1.1.1.5.
The approach to constructing a bow-tie diagram demands that there are equivalent safeguards on both sides of the bow-tie. This conforms to the HSE Hierarchy requirement – Eliminate – Prevent (barriers on the left side of the diagram) and Mitigate – Recover (controls on the right side of the diagram). This ensures both prevention barriers as well as recovery controls exist. The thick black lines in the diagram correspond to the lines of defence (LOD) concept.
1.1.2. When It Might be Used
1.1.2.1.
Bow-Tie diagrams were developed in the Exploration and Production industry and have developed into a structured, methodical approach which has been adopted as a best practice in identifying safeguards in that industry. It has been formulated as a technique for developing Safety Cases and supporting Safety Case Arguments. The technique can also be used in a variety of other industries when risk quantification is not warranted.
1.1.3. Advantages, Disadvantages, and Limitations to The Defence Sector or The Particular Domain
1.1.3.1.
Advantages
- The Bow-Tie Diagram is simple to re ad and understand - it gives a clear understanding of the threat controls and consequences that apply to a system
- The technique is not overly complex and the approach can be understood by non- specialists
- On the left hand side of the diagram the full range of initiating events and intervening safeguards and the way they combine and escalate are clearly shown
- On the right hand side of the diagram the many possible consequences and outcomes are defined and the barriers are shown in an equivalent manner
- The linkage of the barriers to the safety management sy stem can be made explicit
1.1.3.2.
Disadvantages
- Does not provide quantitative assessment or evaluation of the acceptability of risks unless linked to fault tree analysis or event tree analysis
- In depth knowledge required/essential – high level of knowledge regarding a system and the components of the system that relate to safety
- No standards exist therefore there is a range of different and subtle representations of bow-tie diagrams
- The technique does not provide a framework to evaluate whether the selected safeguards are sufficient
1.1.4. Sources of Additional Information
1.1.4.1.
A list of additional information (e.g., Standards, textbooks, and websites) includes but is not limited to:
- Regulating Major Hazards (LOD reference)
- Safety Report Assessment Guide: Explosives (LOD reference)
1.1.5. Additional Comments
1.1.5.1.
A list of software programs (e.g., Computer tools and related techniques) includes but is not limited to:
- Bowtie Master – originally developed by Shell International Exploration and Production (SEIP) and then latterly in conjunction with EQE.
- Bowtie Master Fact Sheet
1.1.6. A Simple Example of a Bow-Tie Diagram
1.1.6.1.
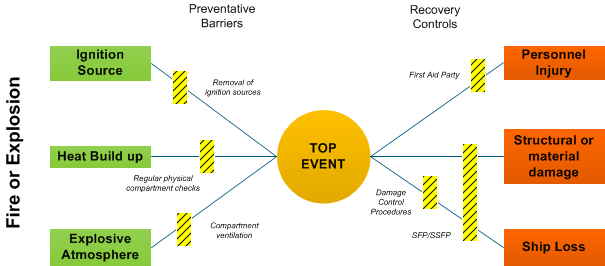
The top-level event of ship structural damage has associated with it a number of hazards: the example below chooses fire or explosion. It should be noted that for clarity not all identified controls and mitigation are shown, an example of preventive and recovery types only are used. This is a simplified bow-tie diagram to demonstrate the process of how it could be evolved by identifying:
1.1.6.2.
| Top-Level Event | ship structural damage due to fire or explosion in a ship's deep magazine |
| Threats | ignition source, heat build up, explosive atmosphere |
| Consequences | personnel injury, structural or material damage, ship loss |
| Barriers | removal of ignition sources, munitions stored in quiescent state, boundary cooling, remote and local fire detection monitoring, regular physical compartment checks, procedures, anti-static precautions, physical design, restricted access |
| Controls | Ships Fire Party (SFP) / Standing Sea Fire Party (SSFP), training, compartment ventilation, blow-off plates |
| Contribution factors | secondary explosions, fire spreads |
| Contribution controls | not mixing ammunition types, magazine sprays, blast plates, Insensitive Munitions, SFP/SSFP, Damage Control Procedures, Life boats, First Aid Party |
1.2. Version Control
1.2.0.1.
Version 3.0 to 3.1 Uplift
Links within Sources of Additional Information and Additional Comments have been updated.
Version 2.3 to 3.0 Uplift
Major uplift from the Acquisition System Guidance (ASG) to online version.