
1.1. Event Tree Analysis
1.1.1. Description and Purpose
1.1.1.1.
Event trees are graphical representations of binary logic models which identify and can quantify possible consequences resulting from an initiating event (e.g. component failure). The event tree provides systematic coverage of the time sequence for the event’s propagation.
1.1.1.2.
Event trees have been widely applied in risk assessments for both the nuclear and chemical industries. Two distinct applications can be identified:
1.1.1.3.
- The “pre-incident” application examines the normal ship functions, crew interventions and protective systems in place which would prevent a pre-incident developing into an actual incident. The event tree analysis of such systems is often sufficient in itself for the purposes of estimating the safety of the system.
- The “post-incident” application is used to allocate the many possible consequences (see Consequence Analysis) following an event, e.g. flammable/toxic releases. The event tree analysis is rarely sufficient in itself for this application; it is usually an input to the determination of outcome frequency used in the risk calculation.
1.1.1.4.
The construction of an event tree is sequential, and like fault-tree analysis, it is top-down (or left-right in the usual event tree convention). Analysis starts at the initiating event and the consequences of this event are then followed through a series of possible branches (outcomes) working through each branch in turn. The questions defining the branches are placed across the top of the tree and are sometimes called nodes. The answers are usually binary (e.g. ‘yes’ or ‘no’), with the convention usually adopted of upward branches signifying ‘yes’ and downward ones for ‘no’, but there can also be multiple outcomes (e.g. 100%, 20% or 0% in the operation of a control valve). Each branch is conditional on the answers to the previous defining questions (nodes).
1.1.1.5.
Quantification of an event tree is relatively simple, and is readily performed by hand, although spreadsheets or computer models are increasingly used to automate the multiplication task. A probability is determined for each branch and the sum of the probabilities of each branch must be unity. The probabilities of each outcome are the products of the probabilities at each branch leading to them. The sum of the probabilities for all outcomes must be unity or must be equal to the initiating frequency. This provides a useful check on the analysis.
1.1.1.6.
Usually an event tree is presented with the initiating events on the left and the outcomes on the right.
1.1.1.7.
Note: that whereas a fault-tree has many initiating events that lead to the single top event, an event tree has one initiating event that leads to many possible outcomes. (DSA02-DMR MOD Shipping Regulations for Safety and Environmental Protection)
1.1.2. When It Might be Used
1.1.2.1.
Event-Tree Analysis is a simple but effective technique and is suitable for many risk assessment applications, but is most often used for major accident hazard assessment.
1.1.3. Advantages, Disadvantages, and Limitations to The Defence Sector or The Particular Domain
1.1.3.1.
Advantages
- It is widely used and well accepted and can be used for cross-discipline system analysis
- It is suitable for many hazards in QRA that arise from sequences of successive failures
- An event tree is clear and logical and therefore simple to understand
- The analysis is not limited to equipment related events
- It can be used to diagnose system difficulties
- “Pre-incident” Event Trees highlight both the value and potential weaknesses of protective systems (especially identifying outcomes with no intervening protective measures).
1.1.3.2.
Disadvantages
- It is not efficient where many events must occur in combination, as it results in many redundant branches
- All events are assumed to be independent which can lead to missing systematic and common-mode failures
- As the technique uses binary logic it may not work for some accident scenarios which include uncertainty such as human error or adverse weather conditions
- The analysis is limited to one initiating event. If ETA is being used to identify potential causes of accidents, other techniques such as HAZOP, FMEA, what-if or checklists should be considered.
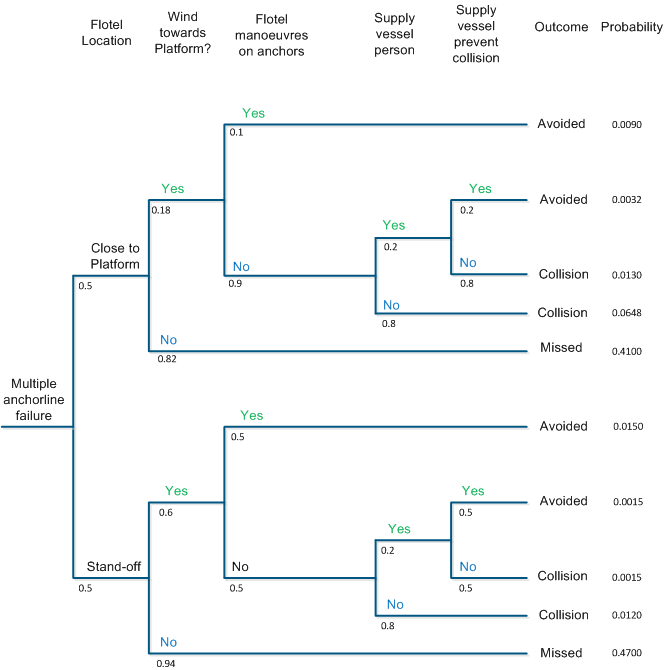
1.1.4. A Simple Example of an Event Tree
1.1.4.1.
The example below is an event-tree of flotel-platform collision probability. This can be found in the HSE Marine Risk Assessment Report
1.1.5. Sources of Additional Information
1.1.5.1.
A list of additional information (e.g., Standards, textbooks, and websites) includes but is not limited to:
- Guidelines for Hazard Evaluation Procedures, American Institute of Chemical Engineers, 2008
- NUREG/CR-2300 - PRAProcedures Guide: A Guide to the Performance of Probabilistic Risk Assessments for Nuclear Power Plants, (Vols. 1 and 2) January 1983.
1.1.6. Additional Comments
1.1.6.1.
A list of software programs (e.g., Computer tools and related techniques) includes but is not limited to:
1.2. Version Control
1.2.1. Version 2.3 to 3.0 Uplift
1.2.1.1.
Version 3.0 to 3.1 Uplift
Links within Sources of Additional Information and Additional Comments have been updated.
Version 2.3 to 3.0 Uplift
Major uplift from the Acquisition System Guidance (ASG) to online version.