
1.1. Description and Purpose
1.1.0.2. Introduction
1.1.0.2.1.
This guidance paper covers both the technique of Cause Consequence Diagrams and three analyses which may be used subsequently, where quantitative ALARP justification is necessary. Both Def Stan 00-056 and the MOD’s POSMS manual give guidance on when quantitative ALARP justification may be required, and this is likely to be for hazards not addressed by the application of good practice and those with the highest levels of Risk.
1.1.0.2.2.
The following three analyses can be used together in selecting which Risk Reduction options to adopt, and therefore support quantitative ALARP justification:
- Loss Analysis – Provides an estimate, in financial terms, of the effect of incidents and accidents identified through consequence analysis
- Options Analysis – Determines candidate optio ns to reduce safety losses
- Impact Analysis – Assesses the effect on the safety losses of candidate mitigation options
1.1.0.3. Consequence Analysis
1.1.0.3.1.
Consequence Analysis is a bottom up, deductive, analytical technique. It examines time-sequenced responses to initiating events. The analysis may be quantified to determine the probability of the range of outcomes possible.
1.1.0.3.2.
Consequence Analysis can be conducted by a various techniques, including the forward looking parts of FMEA, HAZOPS and SWIFT. The findings of Consequence Analysis may be represented graphically with techniques including Event Tree Analysis, Bow-tie Diagrams and Cause Consequence Diagrams. The latter two techniques provide combined representation of both Causal and Consequence analyses and thus can cover complete Accident Sequences from initiating events through to final outcomes.
1.1.0.3.3.
Cause Consequence Diagrams illustrate the failure logic of a system to identify the potential effect of each hazard and possible subsequent accident. The technique can include a determination of the overall risk of all known quantified hazards.
1.1.0.4. Cause Consequence Diagram
1.1.0.4.1.
Cause Consequence Diagrams involve a combination of Causal Analysis and Consequence Analysis. They are used to examine events that might occur between a hazardous state and a resulting Accident, in effect the accident sequence.
1.1.0.4.2.
The ‘Cause’ element is a system activity which may characterize a desired or an undesired event. Safety analysis is generally associated with undesired events and their consequences. The ‘cause’ may be the top event of a Fault Tree Analysis (FTA) and may have a probability associated with it.
1.1.0.4.3.
The ‘Consequence’ element covers activities which may characterize a series of outcomes which, when sequentially evaluated, may develop both successful and unsuccessful events with their own probability of occurrence.
1.1.0.4.4.
The two techniques use a common structure as shown in the example below.
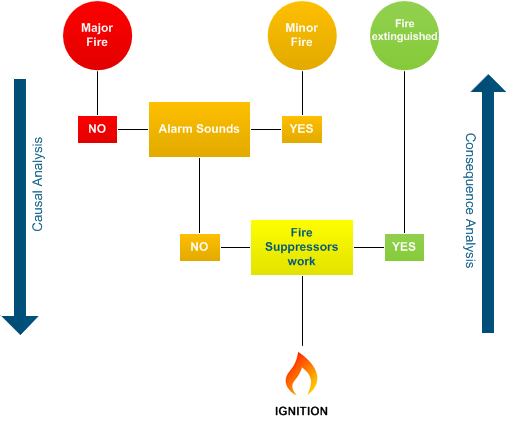
1.1.0.4.5.
In this simple example, the initial event is Ignition, and major factors that influence the outcome are the Fire Suppressor and Alarm states on demand. Significant consequence outcomes range from Fire being extinguished to a Major Fire.
1.1.0.4.6.
To estimate the frequency of the outcome - Major Fire - requires an estimate of the frequency of the initial event (i.e. Ignition) and the likelihood or probability of failure on demand of the barriers to a Major Fire, Fire Suppressor and Alarm, and their correlation. The Risk arising from Ignition can then be determined.
1.1.0.5. Loss Analysis
1.1.0.5.1.
Loss Analysis is a systematic investigation of the Safety losses associated with all Accidents identified through Consequence Analysis. It involves assessment of the magnitude of the losses associated with the Hazards of a system before considering Risk reduction measures. Losses associated with persons (i.e. injuries and deaths) are aggregated separately for each group that may be affected; for a defence system, these groups might include Trained Operators, Trained Maintainers, other MOD personnel and the General Public.
1.1.0.5.2.
Loss Analysis may be carried out qualitatively or quantitatively, and should be repeated using inputs from subsequent Options Analysis and Impact Analysis.

1.1.0.5.3.
Accidents identified as resulting in a safe condition or near miss can be assumed to incur no Safety losses to persons, equipment or the environment, but may well have other operational or cost penalties. All remaining Accidents can be assumed to incur Safety and other losses.
1.1.0.5.4.
The (typically annual) frequency of each Accident is determined in Cause Consequence Diagrams by multiplying the estimated Hazard frequency by the estimated likelihood or probability of the Hazard leading to the Accident, once the Hazard has occurred. Safety losses, whether for personnel, equipment or environment, are typically expressed in monetary terms in order to consider in subsequent Cost Benefit Analysis.
1.1.0.5.5.
Safety losses to persons are estimated in Potential Equivalent Fatalities (PEF) per annum and converted into an equivalent annual fatality figure. Currently accepted conventions should be used, such as those in the Rail industry:
- 1 fatality = 10 major injuries
- 1 major injury = 20 minor injuries
So 1 major injury = 0.1 PEF and 1 minor injury = 5 x 10⁻³ PEF.
1.1.0.5.6.
An example of Loss Analysis is shown below.
| Outcome | Frequency per annum | Safety loss per Accident (personnel) PEF per annum |
Safety loss per annum (personnel) PEF per annum |
||
|---|---|---|---|---|---|
| MOD | Public | MOD | Public | ||
| Fire put out No Injuries |
1 x 10⁻⁴ | - | - | - | - |
|
Minor Fire (2 minor MOD Injuries) |
1 x 10⁻⁶ | 1 x 10⁻² | - | 1 x 10⁻⁸ | - |
|
Major Fire (1 MOD Fatality and 1 major Injury to public) |
2 x 10⁻⁹ | 1 | 0.1 | 1 x 10⁻⁹ | 2 x 10⁻¹⁰ |
| Total per annum | 1.1 x 10⁻⁸ | 2 x 10⁻¹⁰ | |||
Example – Results of personnel Loss Analysis for “Fire” (figures are not representative)
1.1.0.5.7.
A benchmark indication of a reasonably practicable cost of risk reduction is the Value of Preventing a Fatality (VPF), which is used to support ALARP decisions only. A VPF is chosen in order to reflect currently acceptable values in society.
1.1.0.5.8.
Following application of further Risk Assessment techniques of Impact Analysis and Options Analysis, the Loss Analysis table may be revised to demonstrate any Safety improvement obtained by the application of one or more mitigation measures.
1.1.0.6. Options Analysis
1.1.0.6.1.
Options Analysis is used following initial Loss Analysis to determine options to reduce potential Safety losses for each Hazard.
1.1.0.6.2.
Risk reduction options can be summarised as:
- Those that reduce the rate of occurrence of a Hazard;
- Those that limit the consequences of a Hazard once it has occurred.
1.1.0.6.3.
In order to show compliance with the ALARP principle, all potential risk reduction measures must be identified and considered.
1.1.0.6.4.
Many potential options will have been previously identified in the Cause Consequence Diagram technique, as parts of the Accident sequence where a “barrier”, control or mitigation might be possible. Options Analysis uses empirical and creative processes such as checklists and brainstorming for identification of suitable options for Risk Reduction. Direct costs for implementation of each option are included in the assessment.
1.1.0.7. Impact Analysis
1.1.0.7.1.
Impact Analysis examines each potential risk mitigation measure identified in previous stages to determine their effects on the system. Of particular interest are the Safety benefits in terms of reduction in the expected losses (i.e. reduced risk of injuries and/or fatalities).
1.1.0.7.2.
The quantitative and qualitative elements, in turn, of previous stages of analysis should be revisited to identify impacts. Quantitative sensitivity parameters for each option may be derived from Cause Consequence Diagrams developed for the system in question. The likely effects of each mitigation measure will be identified in an Options Analysis in which a Cost Benefit Analysis is performed.
1.1.0.7.3.
For each option identified:
- Determine the impact of the option on the occurrence or escalation of the Hazard;
- Revisit the Cause Consequence Diagram and Loss Analysis to determine losses assuming implementation of each option;
- Consider potential effects of the mitigation option on other systems;
- Calculate the difference between losses/consequences with and without the implementation of the option, to give the Safety Improvement/Cost Benefit of the change.
1.1.1. When It Might be Used
1.1.1.1. Cause Consequence Diagram
1.1.1.1.1.
Cause Consequence Diagrams may be constructed when there is some information available to describe the system design. It can help to identify opportunities for improving the design and the analysis can be refined as the design develops.
- Common cause failure – identification and modelling
- Interdependencies of failures
- Logical consistency and accuracy
1.1.1.1.2.
Key factors in successful use of Cause Consequence Diagrams are:
- Developing a clear understanding of Accident sequences
- Determining physical, procedural and circumstantial barriers in Accident sequences
1.1.1.2. Loss, Options and Impact Analyses
1.1.1.2.1.
These three connected analyses should be used when there is a good understanding of the Accident sequences associated with a system, but whilst there is still the opportunity to implement Risk Reduction options. The use of these analyses should not be delayed until the design is fixed, since a robust ALARP justification requires a thorough consideration of options.
1.1.2. Advantages, Disadvantages, and Limitations to The Defence Sector or The Particular Domain
1.1.2.1. Advantages
1.1.2.1.1.
Cause Consequence Diagram
- A qualitative model of cause and consequence structures can be developed to model possible Accident sequences;
- Quantification can be introduced and improved as data becomes available to produce probabilistic outcomes, where required by high risk;
- The technique facilitates consideration of differing scenarios and barriers to event escalation, which is an essential part of demonstrating the ALARP principle.
1.1.2.1.2.
Loss Analysis
- Loss Analysis is central to the demonstration of ALARP and provides a measure of Safety loss for comparison and selection of Risk reduction measures;
1.1.2.1.3.
Impact Analysis
- Impact Analysis provides confirmation and/or re-evaluates previous analyses to provide a soundly based argument for the Safety value of the change;
1.1.2.1.4.
Options Analysis
- When performed to a high standard, Options Analysis provides a clear demonstration of compliance with the ALARP principle, and a sound basis for consideration of options at later project stages.
1.1.2.2. Disadvantages/Limitations
1.1.2.2.1.
Cause Consequence Diagram
- Software packages for Cause Consequence Diagrams generally do not address interdependencies between barriers, and they rely on barrier strengths remaining constant over time;
1.1.2.2.2.
Loss, Options and Impact Analysis
- The techniques for examining the benefit of Risk Reduction options are time consuming and will be inappropriate for common hazards whose control is well covered by Standards or documented Good Practice;
- The results of these related analyses may be very sensitive to the estimated rates of accident occurrence, the predicted scale of harm and the expected costs and benefits of risk reduction options. The studies must therefore include an examination of the sensitivity of the conclusions to the inputs and assumptions.
- All benchmarks used to identify Safety losses to persons are inexact reflections of views held by society at the time of the analysis and, as such, are liable to change with public perceptions of any particular hazard;
- It is important to review and refine the results of early assumptions and modelling, to ensure that results remain relevant and appropriate;
- Given that only costs directly associated with implementing an option for a particular Hazard are considered, it might be found that there is some positive impact on options for other hazards. Any such potential dependencies should be considered, analysed and apportioned;
- When multiple mitigating options are being considered the order in which they are considered for implementation (Mitigation hierarchy) will affect both the individual and cumulative benefit obtained.
- When considering potential effects of the mitigation option on other systems, the relevance and accuracy of the argument must be demonstrated appropriately and be fully supported. Similarly, when considering supplier or subcontractor arguments, a rigorous assessment of assumptions, models and conclusions must precede their inclusion in the Safety Case;
- Care should be taken to ensure that all dependencies are properly addressed, e.g. those between two identified options for the same or related Hazards;
1.1.3. Sources of Additional Information
1.1.3.0.1.
A list of additional information (e.g., Standards, textbooks, and websites) includes but is not limited to:
1.1.3.1. Additional Comments
1.1.3.1.1.
Cause consequence analysis uses decision trees, operating on the assumption that truly independent variables contribute to occurrences and outcomes, i.e. independent events must occur to bring about an event. Cause consequence analysis looks at the possible outcomes of these events.
1.1.3.1.2.
The cause consequence diagram has been applied to a static system and shown to yield the same result as that produced by the solution of the equivalent fault tree and event tree diagram.
1.1.4. Version Control
1.1.5. Version 2.3 to 3.0 Uplift
1.1.5.1.
Version 3.0 to 3.1 Uplift
Link within Sources of Additional Information has been updated.
Version 2.3 to 3.0 Uplift
Major uplift from the Acquisition System Guidance (ASG) to online version.