
1.1. Safety Risk Matrices
1.1.1. Description and Purpose
1.1.1.1.
A safety risk matrix provides a framework for ranking or classifying safety issues according to their significance. The matrix is sometimes called a “hazard ranking matrix” or a “hazard classification matrix”, but it is strictly applied to accidents, since these have harmful outcomes, whereas hazards only have the potential for harm. The matrix can be used as a risk screening tool to help decide which issues need treatment first or which need not be considered further at this time.
1.1.1.2.
Risk matrices can cover exposure to different types of loss, including harm to humans, damage to the environment, financial loss or impact on reputation. If loss in these diverse categories can be considered in common terms (e.g. the monetary impact of all types of loss), then a single matrix can cover all such issues together and prioritise which are the most significant.
1.1.1.3.
The matrix covers a “risk space” defined by the two component parts of risk, namely likelihood on one axis and consequence (or severity) on the other. Each axis must span the full range of outcomes which are considered possible for the system of interest. Each range is divided into a number of categories or bands (typically between 3 and 8) to define the cells of the matrix.
1.1.1.4.
The bands on the two axes may be defined in terms that are purely qualitative, semi-quantitative or fully quantitative, for example:
- Qualitative:
- Likelihood is (Frequent/Reasonably Probable/Remote/Extremely Remote)
- Severity is (Minor/Significant/Severe/Catastrophic)
- Semi-quantitative:
- Likelihood is (e.g. likely to occur once per year on one site)
- Severity is (e.g. a single death)
- Quantitative:
- Likelihood is (e.g. between 1x10⁻⁴ and 1x10⁻⁵ per year on one site)
- Severity is (e.g. between 1.0 and 10.0 Fatalities and Weighted Injuries)
1.1.1.5.
Each cell of the matrix is assigned an indicator defining the relative significance of issues falling in that zone. This indicator could be:
- A risk descriptor (e.g. Low, Moderate, High, Very High)
- A risk score or index (e.g. a number from 1 to 20)
- A priority category (e.g. High, Medium or Low)
- A risk class (e.g. A, B, C or D)
- A measure of expected rate of harm or loss (e.g. 5.4 Fatalities and Weighted Injuries per year or £45,000 per year)
1.1.1.6.
Where likelihood and consequence are stated quantitatively, the axes are usually considered to have logarithmic scales. Adjacent bands will typically differ by one order of magnitude. In this case, lines of constant risk run diagonally across the matrix and the risk will range by a factor of 100 across the area covered by a single cell. This illustrates that the matrix is a coarse tool which can show large differences in risk, but does not address fine detail, such as compliance with quantitative risk requirements.
1.1.1.7.
To apply the matrix, users must have a list of the relevant safety issues (from Hazard Identification and Hazard Analysis) and estimates of the likelihood and severity of each possible accident (from Risk Estimation). The matrix is therefore a technique for Risk Evaluation which follows on from Risk Estimation. The estimates of accident likelihood and severity may be generated by different methods, depending on the stage of the project, the information available and the significance of the safety issue being explored. For example, the estimates may come from:
- Engineering judgement by Subject Matter Experts with knowledge of similar systems
- Historical data from this or similar systems
- Detailed modelling (e.g. using Fault Tree Analysis and Event Tree Analysis or Bow-Tie Analysis)
1.1.2. When It Might be Used
1.1.2.1.
The matrix is usually set up at an early stage of the lifecycle, defining the framework to be used for risk evaluation at subsequent stages. It should be used early in the lifecycle to provide a coarse sift of the identified safety issues so that attention can be focused on the most significant ones. This attention may involve more detailed analysis to understand complex accident sequences and to apply semi-quantitative or fully quantitative risk assessment techniques where appropriate.
1.1.2.2.
Later in the lifecycle, the risk matrix may be used for determining the appropriate management level for review and acceptance of each safety issue. This ensures that the key risk drivers are brought to the attention of senior managers but they are not swamped with masses of information on less significant matters.
1.1.2.3.
During the in-service stage of the lifecycle the risk matrix technique can be applied to give an indication of significance for new safety concerns, such as those revealed by incidents or due to proposed design changes. Risk monitoring can be focused on the issues of highest significance as well as targeting resources for risk reduction.
1.1.3. Advantages, Disadvantages, and Limitations to The Defence Sector or The Particular Domain
1.1.3.1.
Advantages
- Risk matrices provide a quick appreciation of the most significant issues so that attention can be focused where it will have most benefit.
- Matrices provide a visual representation which is easily understood and so aids communication with non-specialists.
- Risk matrices can cover impacts which are different in nature (e.g. harm to people, harm to the environment, material or financial loss), provided that these can be equated in common units (e.g. in money terms).
1.1.3.2.
Disadvantages
- Risk matrices are good for examining different issues affecting one system or activity on the basis of their risk relative to each other. They are not effective for understanding absolute risk.
- There is no single, correct interpretation of the level at which “safety issues” should be selected for presentation on the risk matrix. This means that different analysts may choose different levels and the resulting list of prioritised issues is somewhat subjective. The apparent results may be changed by “accident splitting” (i.e. defining one safety issue as two or more different accidents, each of which will appear to have lower risk).
- Risk matrices consider safety issues one at a time and so do not help understanding the overall or aggregate risk exposure.
- When a variety of different outcomes is possible from a single issue (e.g. fire – consequences can range from no harm to multiple deaths) it can be difficult to choose which likelihood and consequence combination should be used.
- As a broad-brush technique, risk matrices should not be used for considering whether quantitative risk targets have been met or as the only technique for examining complex or high consequence issues. The matrix can, however, highlight high consequence issues so that they then receive more detailed consideration.
1.1.4. Sources of Additional Information
1.1.4.1.
A list of additional information (e.g., Standards, textbooks, and websites) includes but is not limited to:
- ISO 31000 - Risk Management
- Petroleum and Natural Gas Industries – Offshore Production Installations – Guidelines on Risk Assessment (ISO17776:2016)
- GEIA-STD-0010: Standard Best Practices for System Safety Program Development and Execution
- Def Stan 00-056: Safety Management Requirements for Defence Systems - Requirements and Guidance
1.1.5. Additional Comments
1.1.5.1.
It should be noted that risk matrices from different standards and industry sectors are not always represented in the same way. The most common convention has a Cartesian representation (i.e. values increasing left to right and bottom to top on the two axes) so that risk increases from bottom left to top right, but the examples below show that several common matrices have a different format.
1.1.5.2.
If risk estimates are generated by a team of Subject Matter Experts, their deliberations can be biased (consciously or unconsciously) if they know the risk matrix framework. There may be a tendency to choose likelihood and/or severity estimates that result in a lower apparent risk so that it attracts less management scrutiny.
1.1.5.3.
Uncertainty of the estimates of severity and likelihood can be represented on a risk matrix by showing that risk with error bars rather than a single point. This can help understanding by senior managers.
1.1.5.4.
Using common matrices for different systems does not necessarily result in risk estimates that can be compared in a meaningful way. The systems may have diverse risk exposure factors (e.g. number of people exposed, usage rate) and different number and type of accidents to consider.
1.1.6. Examples
1.1.6.1.
The following example matrices show some of the variations in format, terminology and risk indicator across a range of sectors and standards.
Example 1: IEC 31010
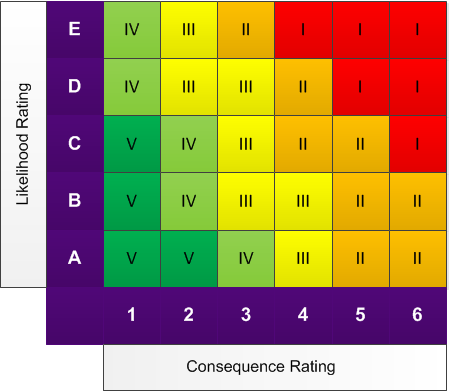
Example risk ranking matrix. Severity on x-axis increasing left to right, likelihood on y-axis increasing bottom to top, with five “risk levels” which are linked to decision rules such as the level of management attention or the time scale by which response is needed.
Example 2: Def Stan 00-56 Issue 2
Example accident risk classification table. Severity on x-axis increasing right to left, likelihood on y-axis increasing bottom to top, four risk classes identify significance and so management level for approval.
| Catastrophic | Critical | Marginal | Negligible | |
| Frequent | A | A | A | B |
| Probable | A | A | B | C |
| Occasional | A | B | C | C |
| Remote | B | C | C | D |
| Improbable | C | C | D | D |
| Incredible | C | D | D | D |
Def Stan 00-56 Issue 2 Example Accident Risk Classification Table
Example 3: IMO Guidelines on FSA
Example hazard risk index matrix. Severity on x-axis increasing left to right, likelihood on y-axis increasing bottom to top, risk index (RI) in each cell calculated by adding .Severity Index (SI) for column and Frequency Index (FI) for row. RI can be considered as log(risk), obtained by adding FI and SI.
| FI | Frequency | Severity (SI) | |||
| 1 | 2 | 3 | 4 | ||
| Minor | Moderate | Serious | Catastrophic | ||
| 7 | Frequent | 8 | 9 | 10 | 11 |
| 6 | 7 | 8 | 9 | 10 | |
| 5 | Reaonably probable | 6 | 7 | 8 | 9 |
| 4 | 5 | 6 | 7 | 8 | |
| 3 | Remote | 4 | 5 | 6 | 7 |
| 2 | 3 | 4 | 5 | 6 | |
| 1 | Extremely remote | 2 | 3 | 4 | 5 |
IMO Guideline on FSA: Risk Ranking Matrix
Example 4: ISO 17776 Offshore Sector
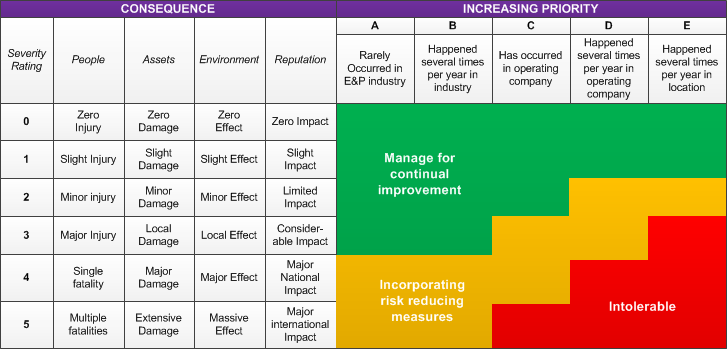
Example risk matrix. Severity on y-axis increasing top to bottom, likelihood on x-axis increasing right to left to top, matrix areas define future action to be taken.
1.2. Version Control
1.2.0.1.
Version 3.0 to 3.1 Uplift
Links within Sources of Additional Information have been updated.
Version 2.3 to 3.0 Uplift
Major uplift from the Acquisition System Guidance (ASG) to online version.